Build Live Dashboards in Claude from Google Analytics, Search Console, Ads and More
Claude can now build live dashboards. With the AI Data Stream connector it builds them from every source you have connected: Google Analytics, Search Console, ad platforms, your CRM, Cloudflare and more. Here are real examples, the prompts we used, and how to check every number.
On 8 October Anthropic launched Claude Dashboards in beta. You ask a question in plain language, Claude pulls the data, builds a dashboard and keeps it current.
The announcement leads with data warehouses like BigQuery and Snowflake, then adds one line that matters more to most marketers: dashboards “work with your other connectors too”. The AI Data Stream connector is one of those, so we tried it.
Because the connector carries every data source you have connected, one dashboard can mix them: Google Analytics, Search Console, Google Ads, Meta Ads, LinkedIn Ads, HubSpot or Pipedrive, Cloudflare, Core Web Vitals, PageSpeed, Google Tag Manager, GitHub, WordPress, backlinks and your sitemap. This post shows three dashboards we built from real data, the exact prompts, and what you can inspect afterwards.
What you need
- A paid Claude plan. Dashboards are in beta on Pro, Max, Team and Enterprise. On Enterprise an admin has to switch them on first.
- The AI Data Stream connector added to Claude. That needs a Pro or Business plan with External AI Access enabled. The setup guide takes a few minutes.
- Some patience. Our builds took between five and fifteen minutes each, on Claude Opus 5.5 at medium effort.
We used the Claude desktop app and simply asked for a dashboard in a normal chat.
Example 1: is AI reading our site, and does it send visitors?
This is a question no single tool answers. Cloudflare sees the AI crawlers, Google Analytics sees the visits that arrive from AI tools, and Search Console has the organic clicks to compare against. We ran it on superyachtwatch.com, a site we run, which has all three connected.
Using AIdata for superyachtwatch.com: are AI assistants reading our site, and is it sending us visitors? Build a dashboard for the last 30 days showing which AI crawlers hit us and which pages they fetch most (Cloudflare), how many sessions arrive from AI tools like ChatGPT and Perplexity (GA4), and how that compares with organic search clicks (Search Console).Claude confirms the plan, then a placeholder holds the space while it works.
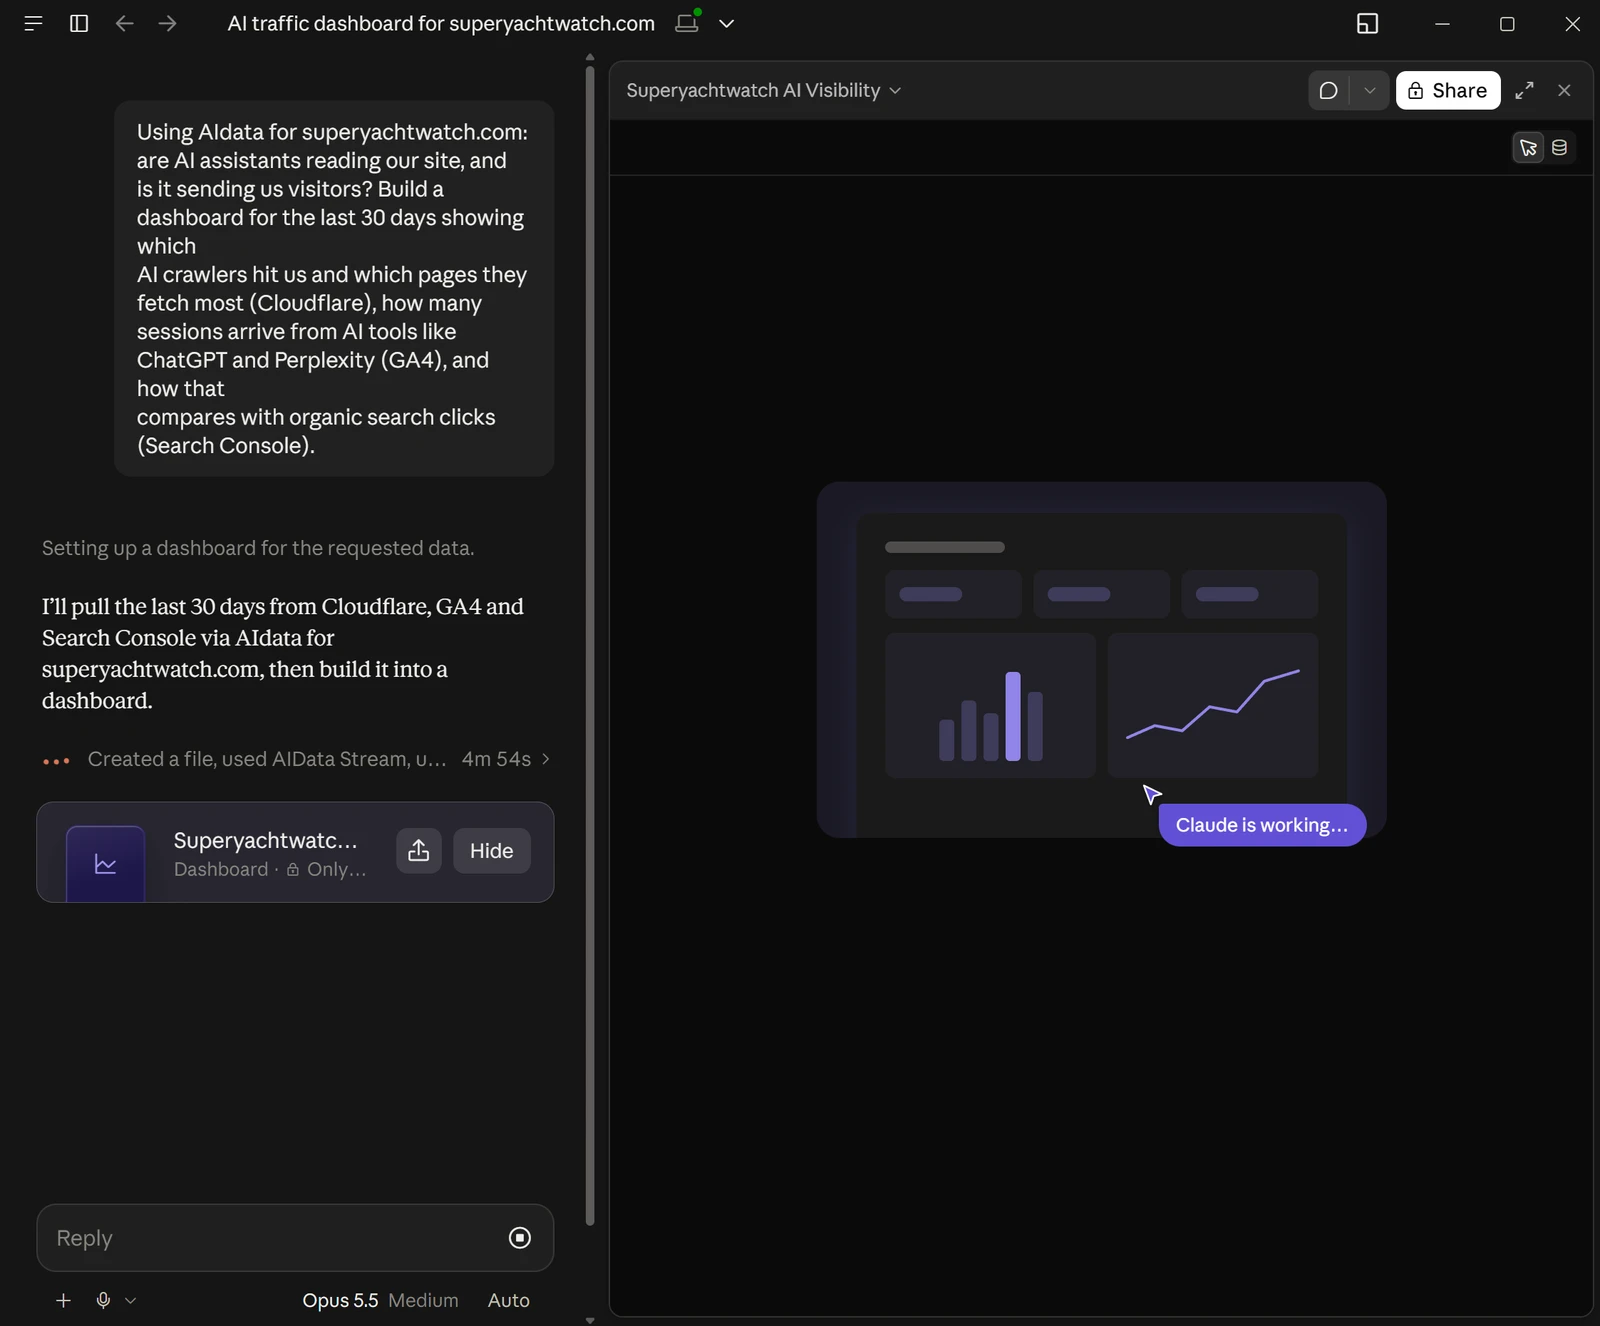
What Claude does while you wait
Expanding the step list shows the connector at work. Claude loaded the connector, listed our properties to find the right one, then called the Cloudflare, GA4 and Search Console tools more than a dozen times before writing any dashboard code.
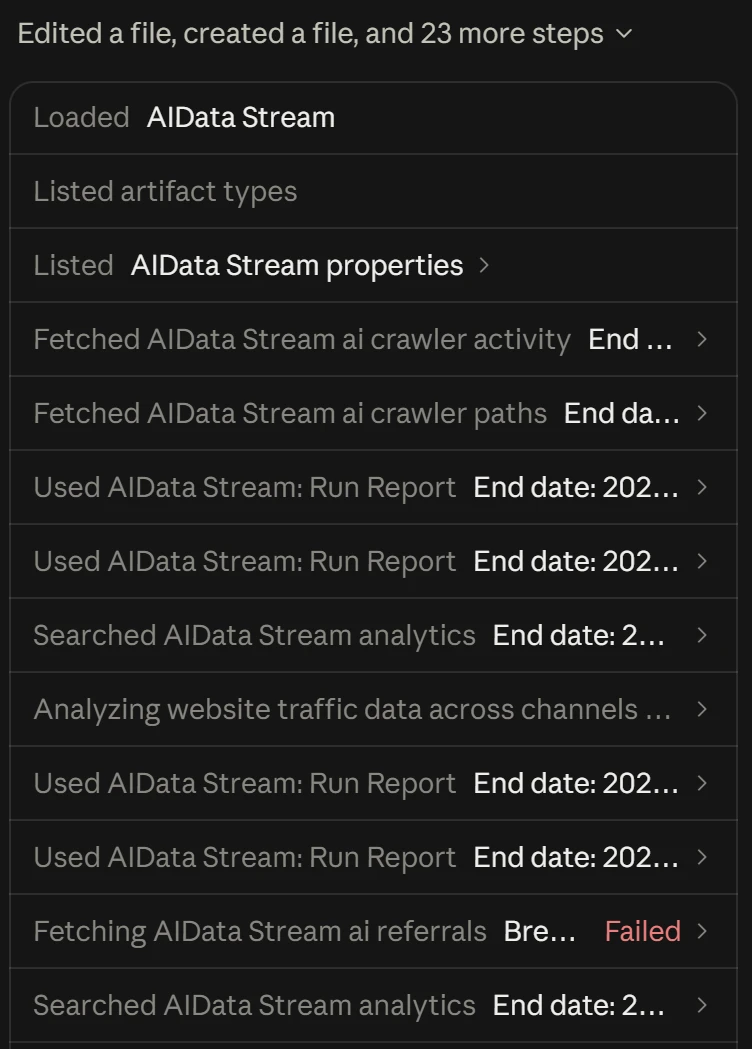
One call failed. Cloudflare only reports AI referrals on a paid Cloudflare plan and this site is on the free one. Claude carried on, took the visit numbers from GA4 instead, and said so in the finished dashboard. After publishing it ran the queries again to check the date ranges and the shape of the answers.
The result
The dashboard opens with a one-sentence answer and five headline figures.
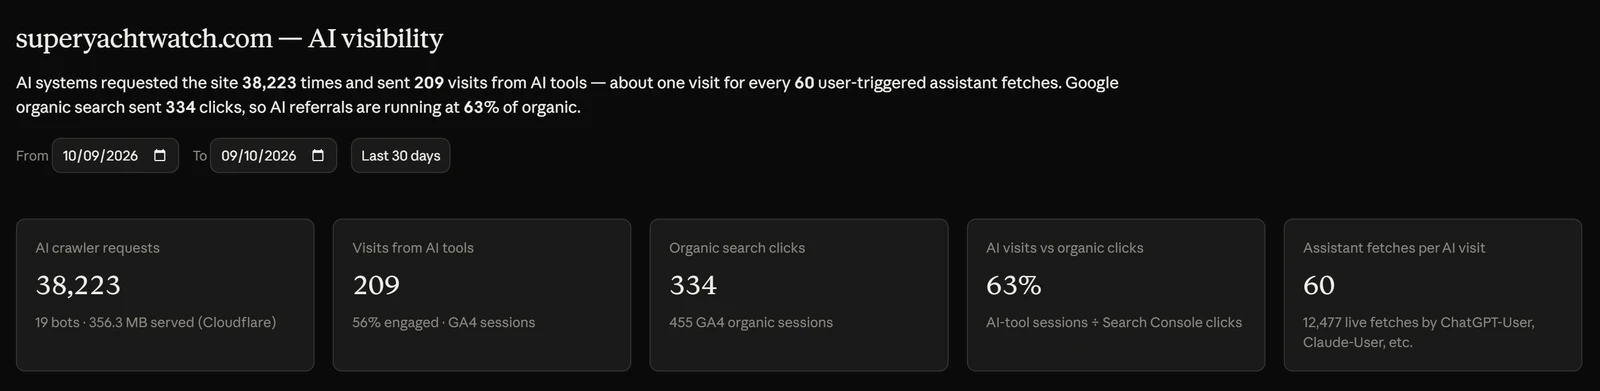
In 30 days, AI systems requested the site 38,223 times and sent 209 visits. Google organic search sent 334 clicks over the same period, so AI referrals are already running at 63% of organic.
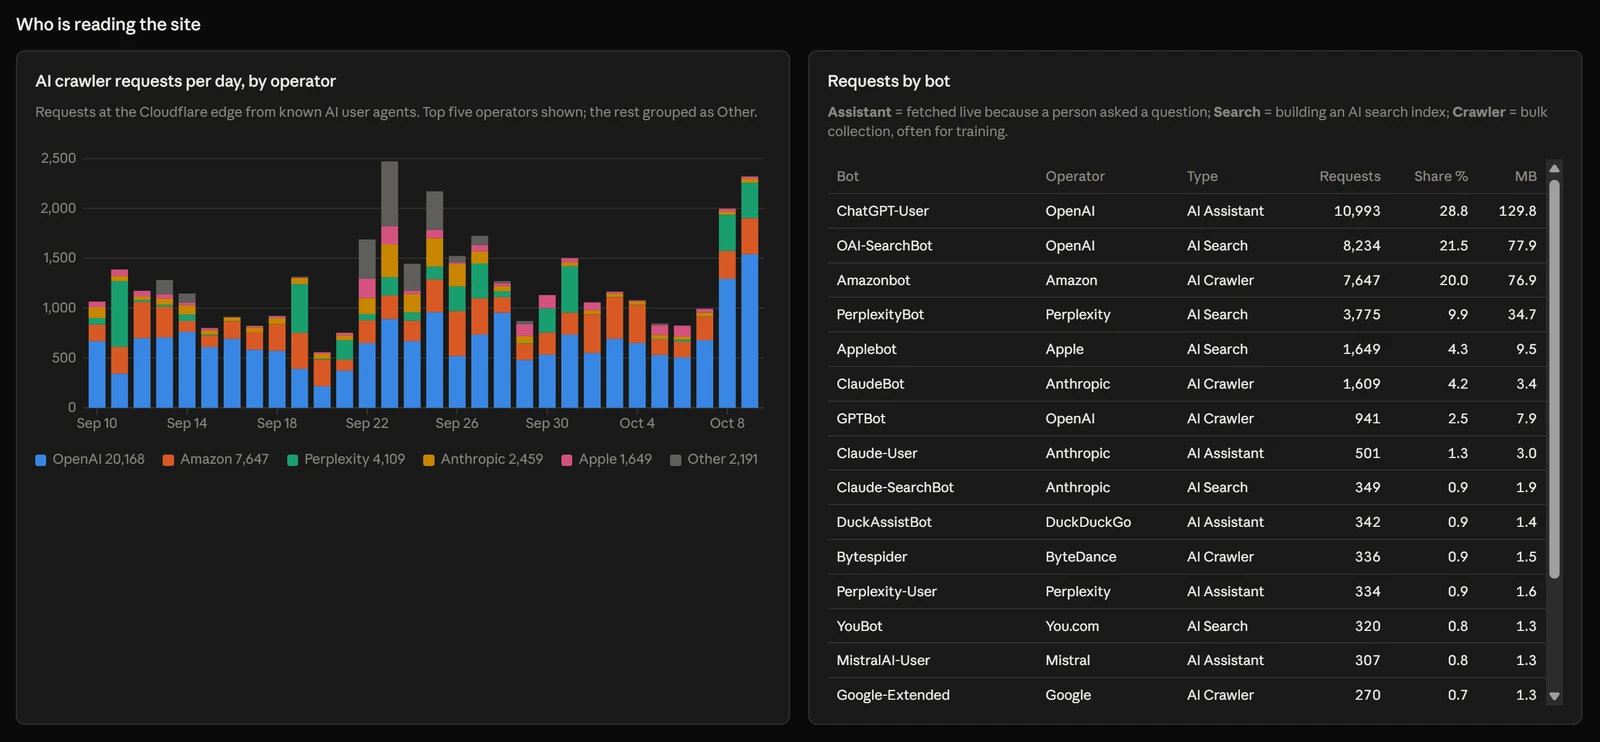
The bot table separates three kinds of traffic that usually get lumped together: assistants fetching a page live because a person asked a question, search bots building an AI search index, and crawlers collecting in bulk. OpenAI accounts for just over half of all requests.
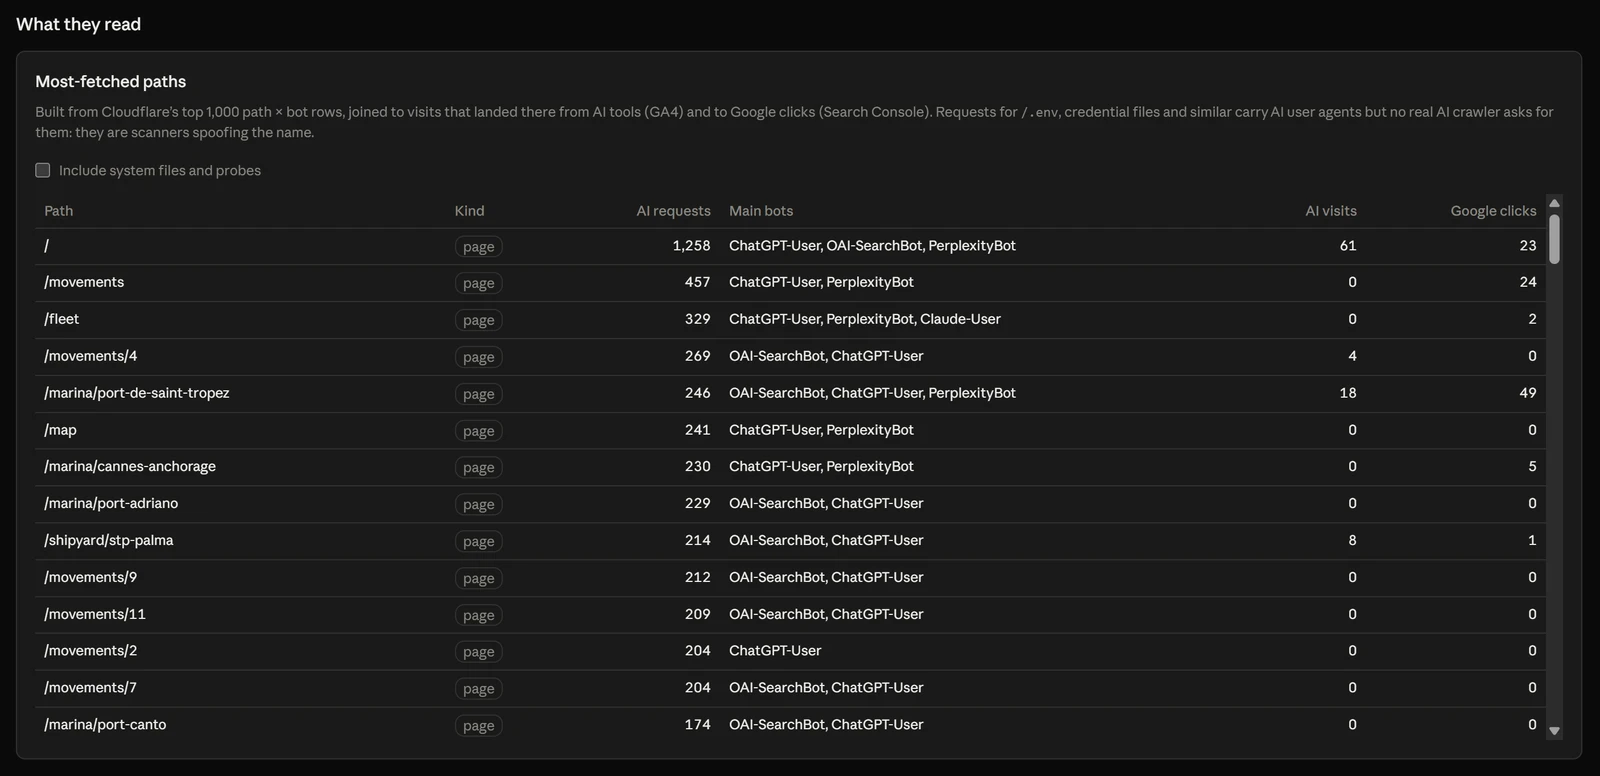
This table is where the three sources meet. Each path shows its AI requests from Cloudflare, the AI visits that landed there from GA4, and its Google clicks from Search Console.
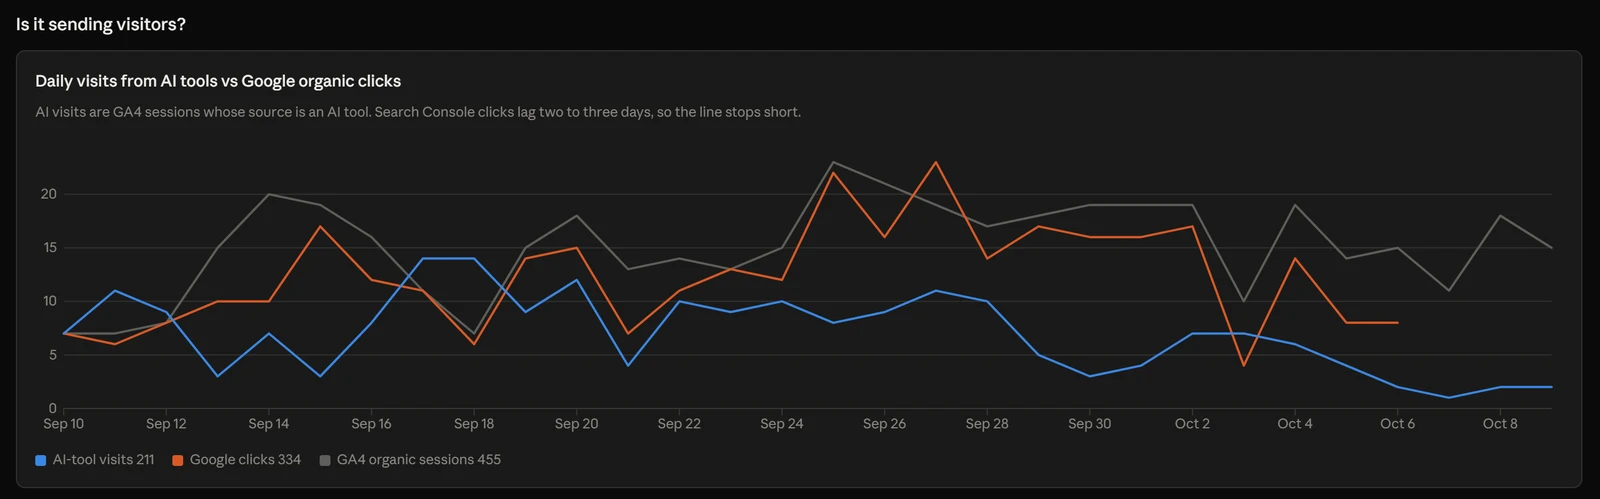
Things we learned that we weren’t looking for:
- Reading rarely becomes visiting. There were about 60 live assistant fetches for every visit an AI tool sent.
- Almost all AI visits come from ChatGPT. It sent 206 of the 209 sessions. PerplexityBot made 3,775 requests and Perplexity sent two visits.
- Some “AI bots” are fakes. Around 2,400 requests carried AI user agents but asked for
/.envand credential files. They are scanners borrowing the name. Claude spotted this and hid them behind a checkbox. - AI visits are a floor. Apps that strip the referrer show up as Direct in GA4, and the dashboard’s notes say so.
If you want the background on why these bots behave so differently, see how AI assistants search the web.
Check every number
Anthropic’s version of this for warehouses is “click any number to see the SQL behind it”. With a connector there is no SQL, but there is an equivalent. The Sources panel lists everything the dashboard is built from. Ours had 13 sources: eight queries that go out through the connector, and five formulas that combine them.
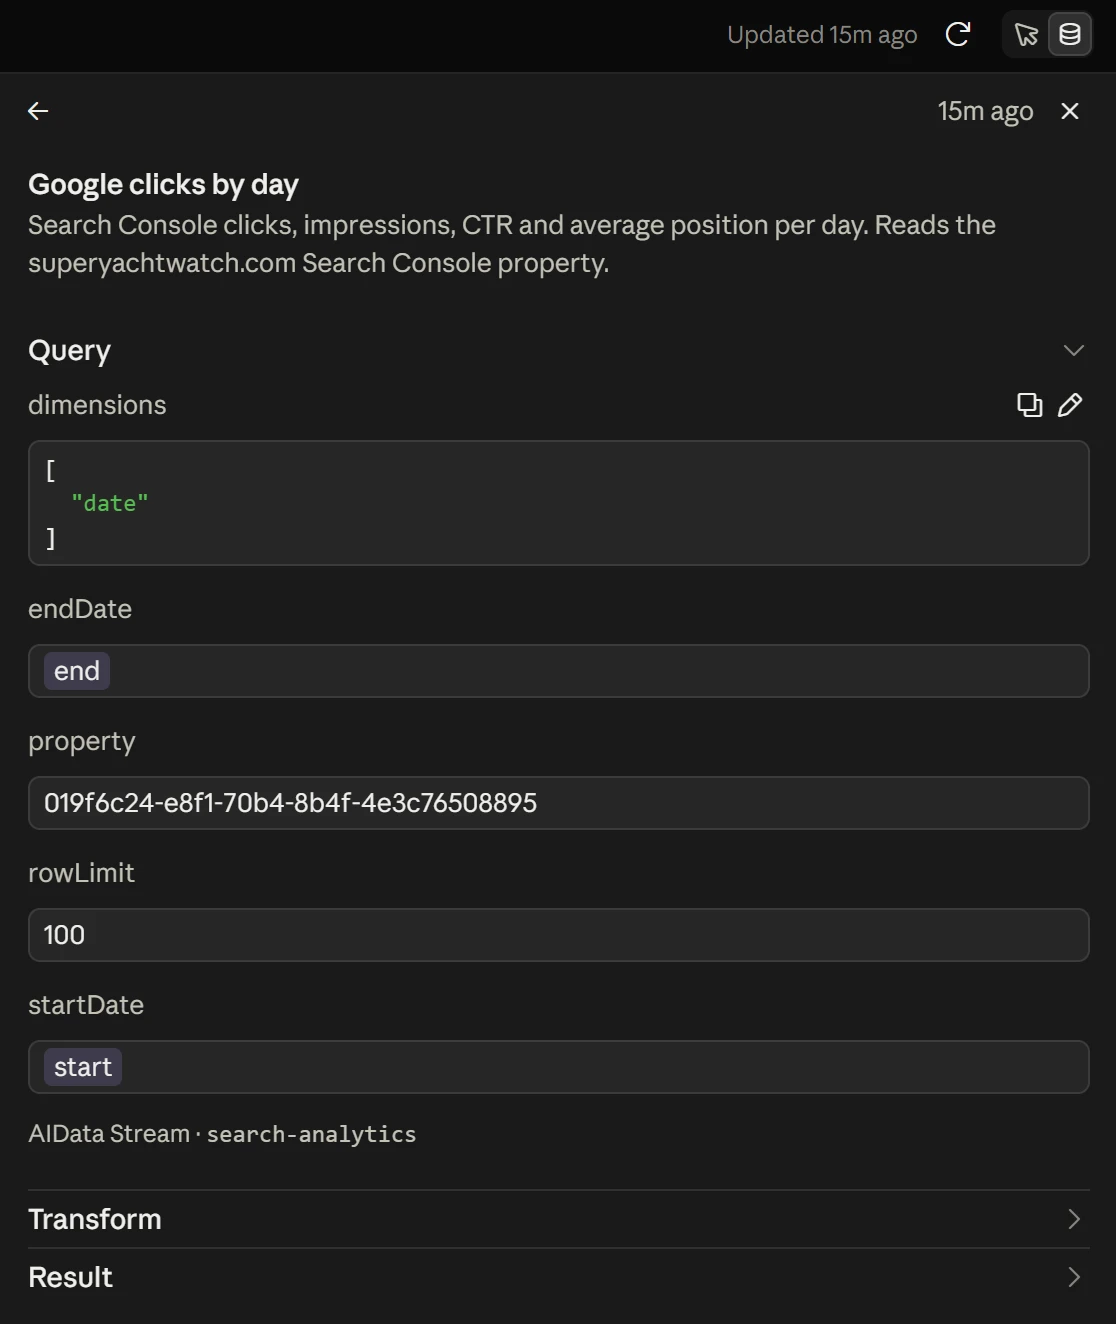
A query source shows the exact AI Data Stream tool and the arguments Claude passed. The start and end dates aren’t fixed values. They are tied to the date range at the top of the dashboard.
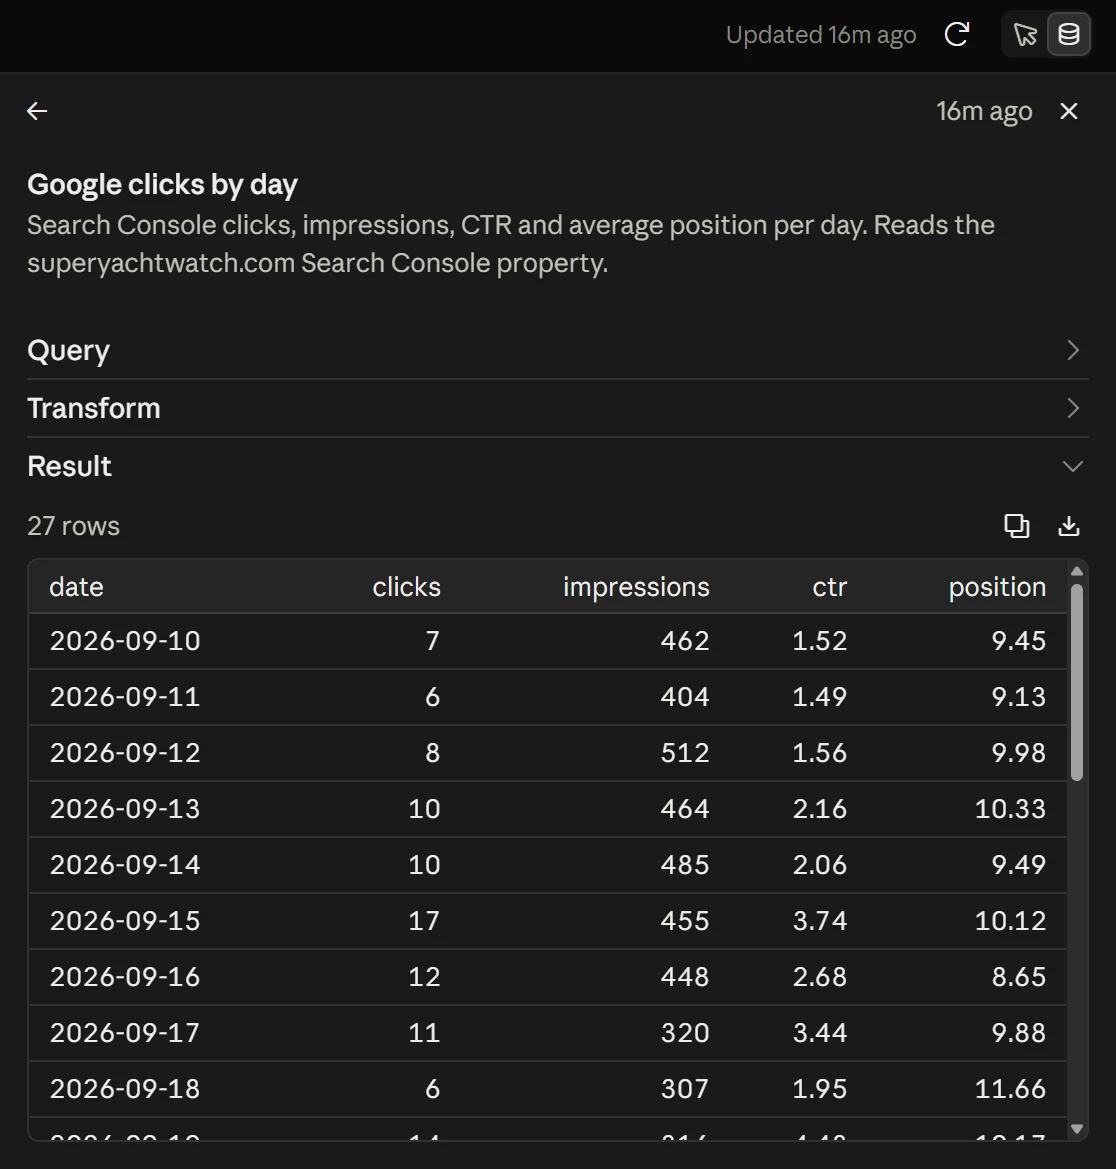
The same source shows the rows that came back, with buttons to copy them or download a CSV.
A formula source names the queries it draws on and shows the code that joins them. This is the one behind the most-fetched paths table.
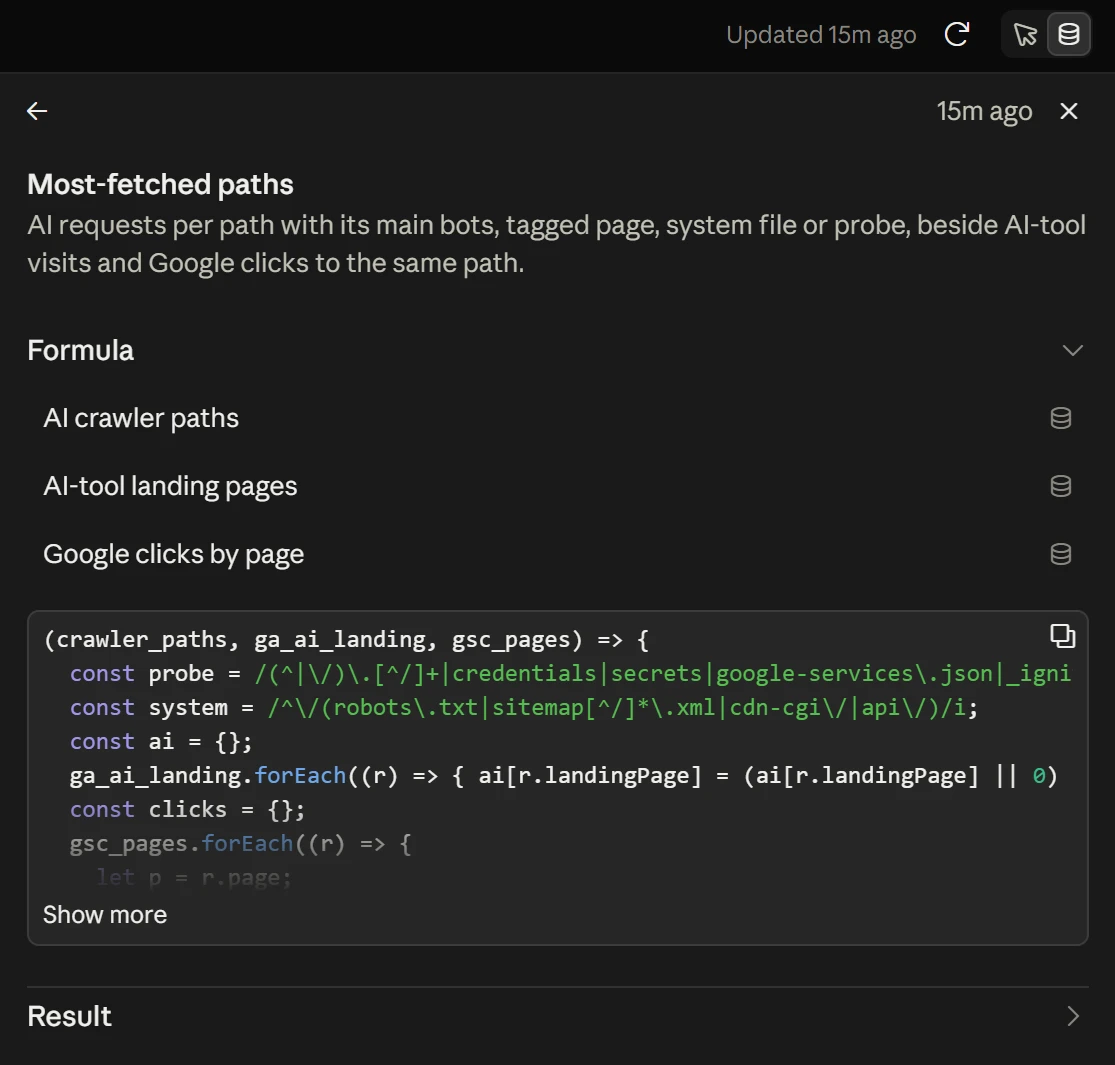
So every figure traces back either to a named tool call you can read, or to a formula over those calls. If a number looks wrong, tell Claude what to change, or edit the query yourself.
Example 2: one source, one screen
You don’t need three sources to get something useful. This prompt uses Search Console only and asks Claude to keep it small.
Using AIdata for superyachtwatch.com: which searches are we close to winning? Build a dashboard of Search Console queries ranking in positions 5 to 15 over the last 28 days, sorted by impressions, with the page that ranks and its click-through rate. Keep it to one screen: a few headline figures, one chart and one table.It took about five minutes.
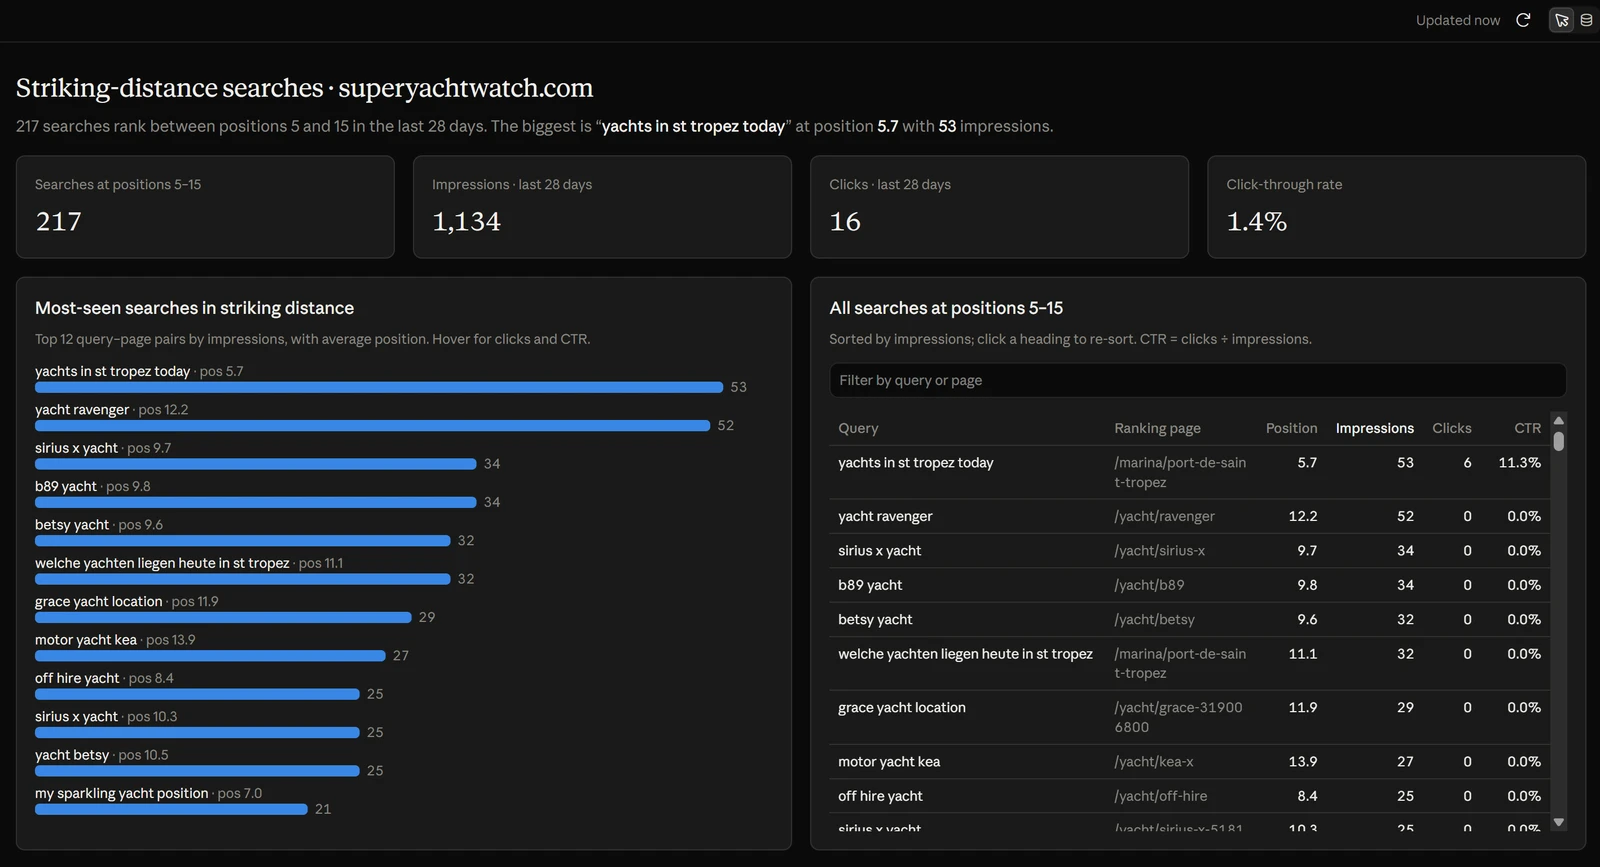
It found 217 searches ranking between positions 5 and 15, with 1,134 impressions and only 16 clicks between them. The table sorts and filters, so it works as a to-do list: these are the pages where a small ranking gain is worth the most.
Example 3: ad platforms side by side
The third example compares Google Ads and Meta Ads, with GA4 as the referee. It comes from a client account, so we told Claude in the prompt to leave out anything that identifies them. The figures are real. The site, brand, account and campaign names have been withheld, which is why the campaigns are lettered. Left alone, Claude would show the real campaign names.
Using AIdata for [client site]: what are we paying for a lead, and which platform earns it? Build a dashboard for the last 30 days comparing Google Ads and Meta Ads: spend, clicks, conversions and cost per conversion by platform and by campaign, with a daily spend trend, next to GA4 sessions and key events from paid traffic. This will be published as an anonymous example, so do not show the site, brand or account name anywhere: title it "Paid media overview", and label campaigns as Campaign A, Campaign B and so on in order of spend. Leave out keywords, search terms, ad copy, landing page URLs and locations. Keep it to one screen.This one also took about five minutes, with three sources.
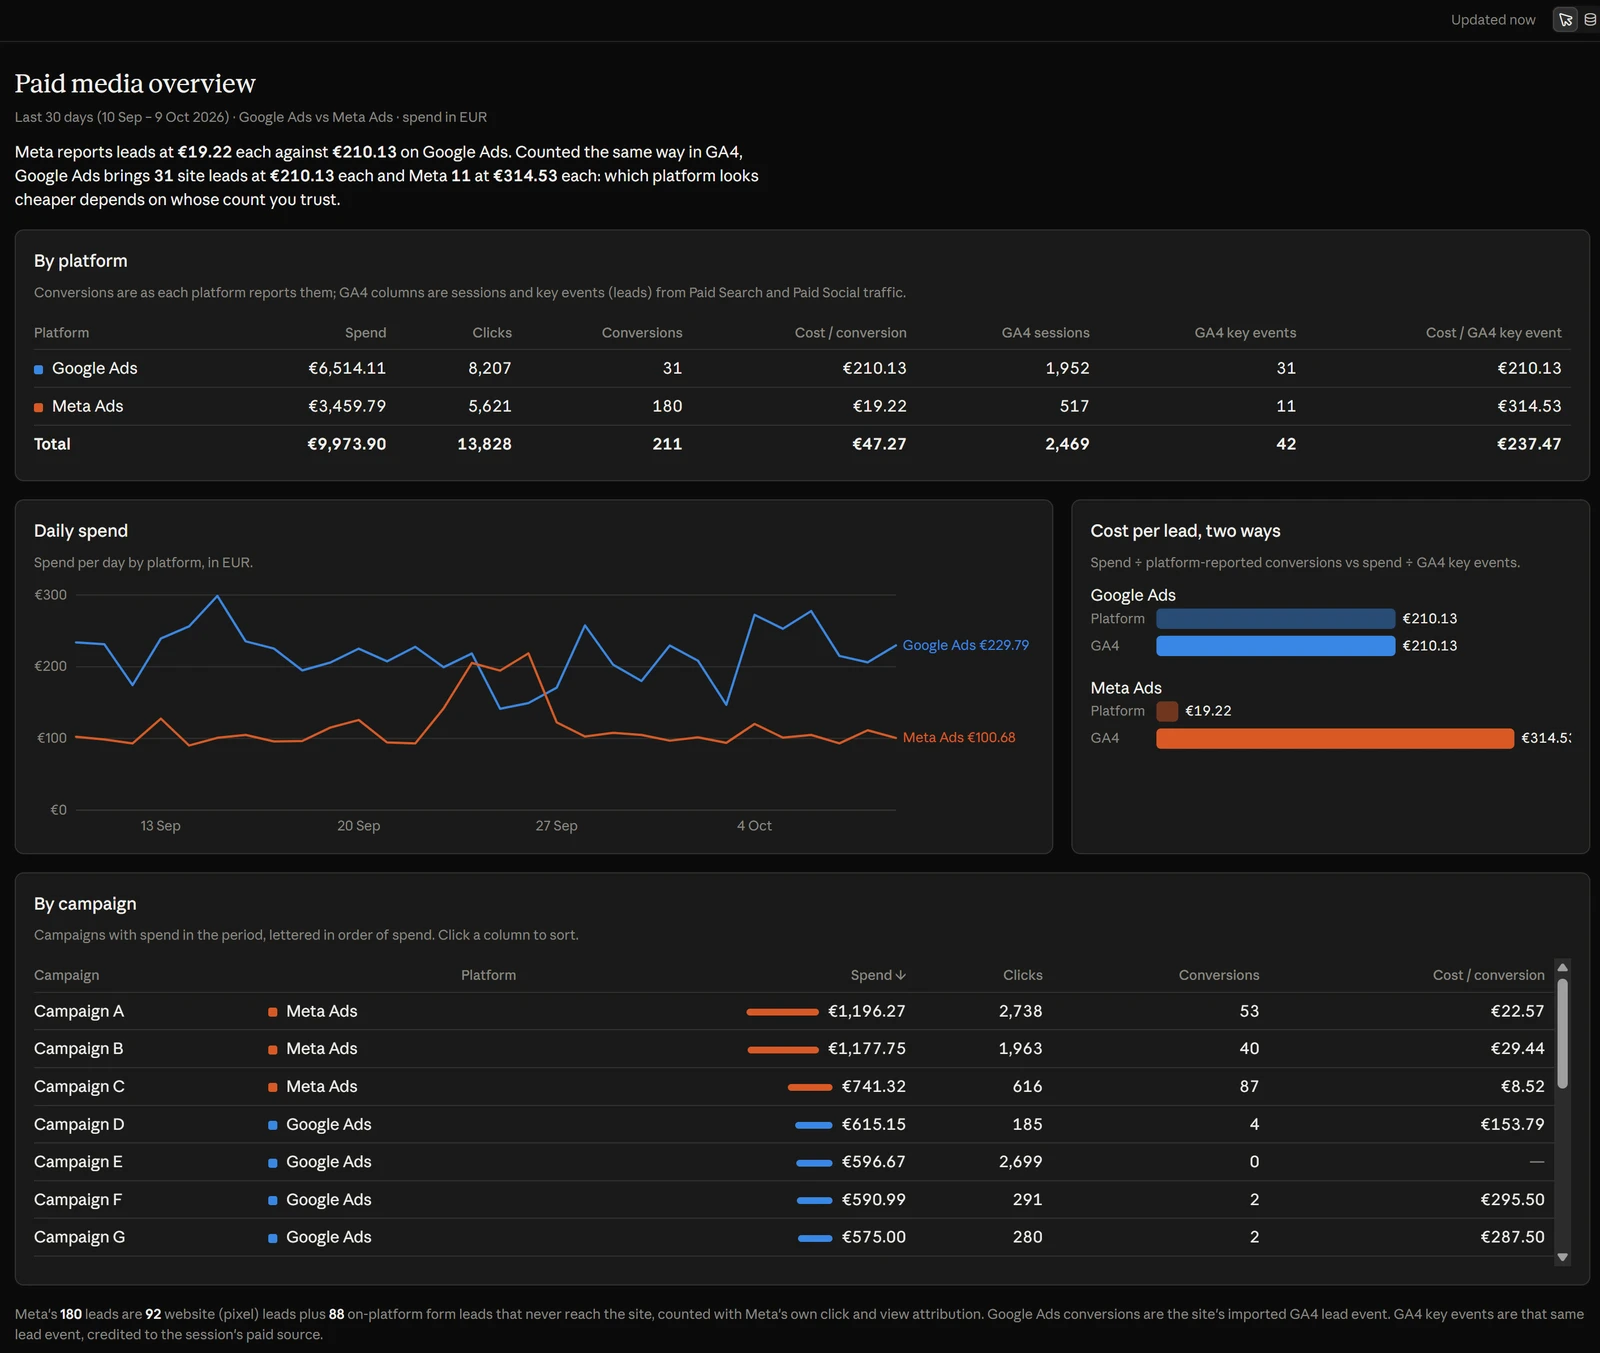
The interesting part is the panel on the right. Going by each platform’s own numbers, Meta looks about eleven times cheaper: €19.22 a lead against €210.13 on Google Ads. Counted the same way for both, as lead events in GA4, the order flips: €210.13 for Google Ads and €314.53 for Meta.
Claude explains the gap in a footnote. Nearly half of Meta’s 180 leads are on-platform forms that never reach the site, and the rest are counted with Meta’s own click and view attribution. Neither number is wrong, but you can only see the difference when both platforms and your analytics sit in one place.
The same instruction is handy beyond blog posts. If you want a dashboard you can show in a pitch or a case study, ask Claude to anonymise it as it builds.
Writing prompts that work
- Ask a question, not for a chart. “Which searches are we close to winning?” gets a better dashboard than “make a bar chart of queries”.
- Name the property. Start with “Using AIdata for yoursite.com” so Claude picks the right one straight away.
- Name the sources if you know them. Putting “(Cloudflare)” or “(Search Console)” after each part removes the guesswork.
- Set the size. Both dashboards we limited to one screen took about five minutes, one with a single source and one with three. An open-ended request across every connection took fifteen.
More prompts to try
These are starting points we haven’t walked through here. Swap in your own site.
- What Google Analytics doesn’t see: “How much of our traffic never shows up in Google Analytics? Compare Cloudflare visits with GA4 sessions day by day for the last 30 days and show the gap as a percentage.”
- Did shipping change anything: “Did our recent releases help or hurt? Show weekly commits and deployments from GitHub alongside Core Web Vitals, search clicks and GA4 sessions for the last 90 days.”
- Is new content getting found: “Show the URLs added to the sitemap in the last 60 days with each one’s impressions and clicks in Search Console and its sessions in GA4. Highlight pages with no impressions yet.”
- From ad spend to pipeline: “What are we paying for a qualified lead? Show spend, clicks and conversions for Google Ads and Meta Ads next to the deals created in HubSpot for the last 90 days.”
- Monday morning overview: “What changed last week? Compare the last 7 days with the 7 before: sessions and key events by channel, search clicks, rising and falling queries, and whether Core Web Vitals pass on mobile.”
Good to know
- Dashboards start private. You share them from the Share menu. Claude’s closing note on ours was that “each person who opens the dashboard needs their own access to that property”, so a teammate needs their own AI Data Stream connector to see live figures.
- Your plan limits still apply. If a connection or plan doesn’t include something, the call fails and Claude works around it, as it did with Cloudflare AI referrals here.
- They count towards your Claude usage. A dashboard is a long build with many tool calls.
- They don’t replace scheduled reports. For a report that lands in your inbox every Monday, skills and scheduled reports in AI Data Stream are still the better tool. Dashboards are for questions you want to keep an eye on.
Try it with your own data
If you already use the connector, open Claude and ask for a dashboard. If you’re new to AI Data Stream, it takes three steps:
- Sign up free and connect Google Analytics and Search Console.
- Move to Pro when you want the Claude connector. Pro also adds Google Ads, Meta Ads, LinkedIn Ads, Cloudflare and the other Pro integrations.
- Add your personal connection URL to Claude with the setup guide, then ask your first question.
Ready to see your own numbers on a dashboard? Try AI Data Stream free →
Related Posts
How AI Assistants Search the Web (And What It Means for Your Visibility)
Claude, ChatGPT, Gemini, and Perplexity all search the web differently - and they don't all use Google. Here's what actually drives AI search visibility and what you can do about it.
Most of Your 'AI Crawler' Traffic Isn't AI
We checked two days of Cloudflare logs for our own site: roughly six in ten requests wearing an AI crawler name were vulnerability scanners probing for .env files and keys. How to tell them apart, two free Cloudflare rules that block them, and the one mistake to avoid.
How to Recover From a Google Core Update (Without Making It Worse)
Confirmed a core update hit your site? Here's a realistic recovery plan: what not to touch, how to find the pages and queries that lost, what to change, and how to measure whether it worked.